W. E. B. Du Bois: Charting Black Lives
8 November 2019 – 1 March 2020
Exhibited at the House of Illustration
Pioneering infographics that challenged racism in turn-of-the-century America.
This exhibition displayed the complete set of infographics produced by W. E. B. Du Bois for the 1900 Paris Exposition.
Revered by everyone from Martin Luther King Jr. to Beyoncé, Du Bois stands as one of the most important and influential intellectuals of the 20th century. While Du Bois is widely celebrated as the author of The Souls of Black Folk and as the co-founder of the NAACP, his pioneering infographics are less well known.
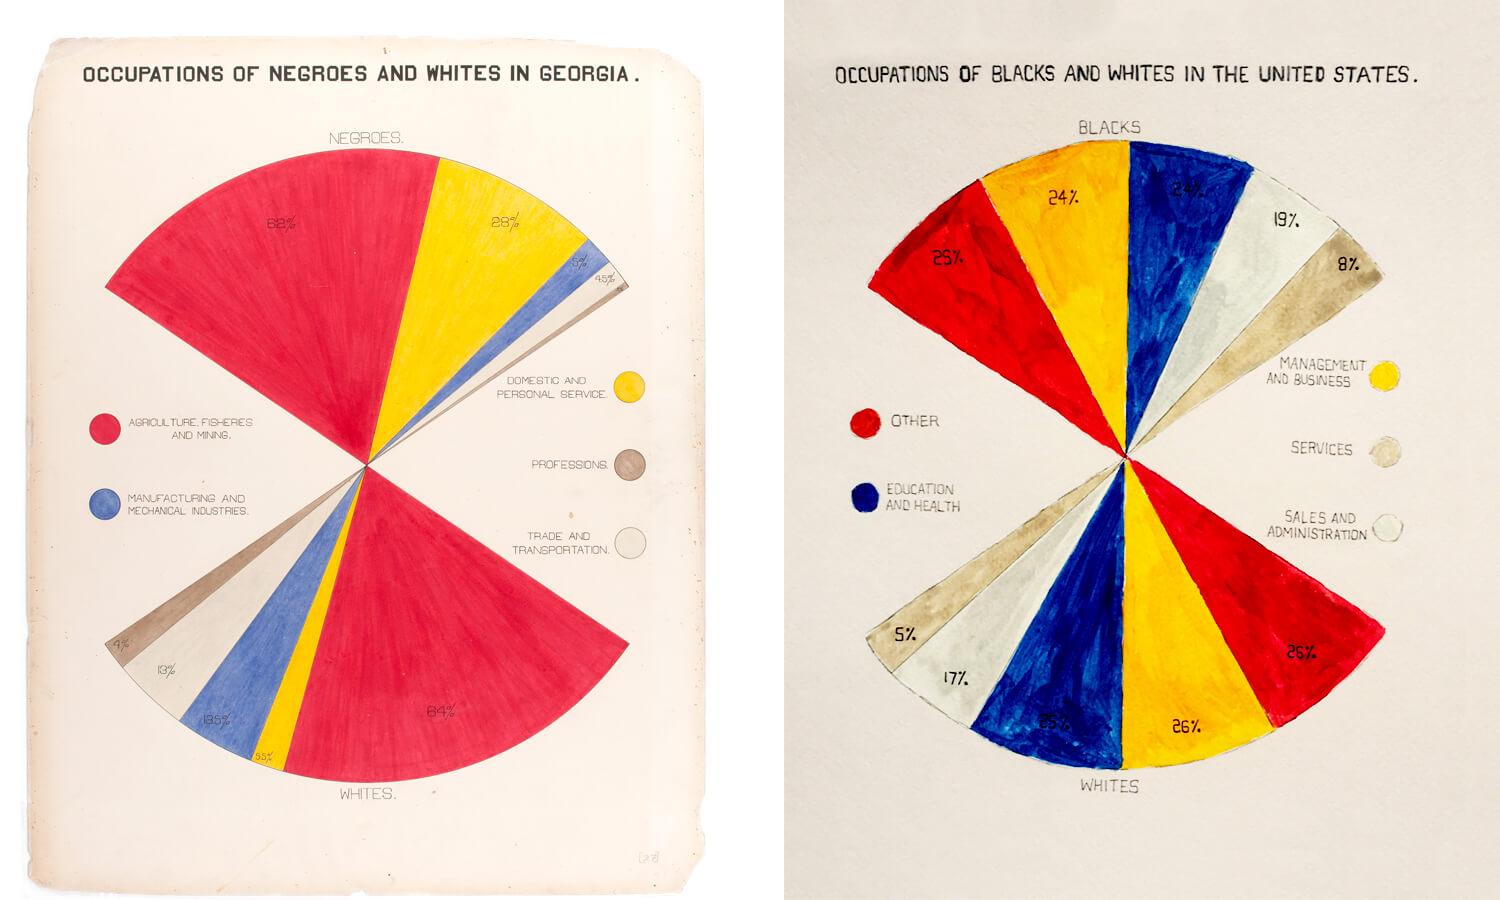
Charting Black Lives reproduced the 63 data visualisations Du Bois created with a team of African American students from his sociology laboratory at Atlanta University. These visually innovative graphs, charts and maps formed a radical new approach to refuting racism, using strikingly presented facts and statistics to counter contemporary white supremacy.
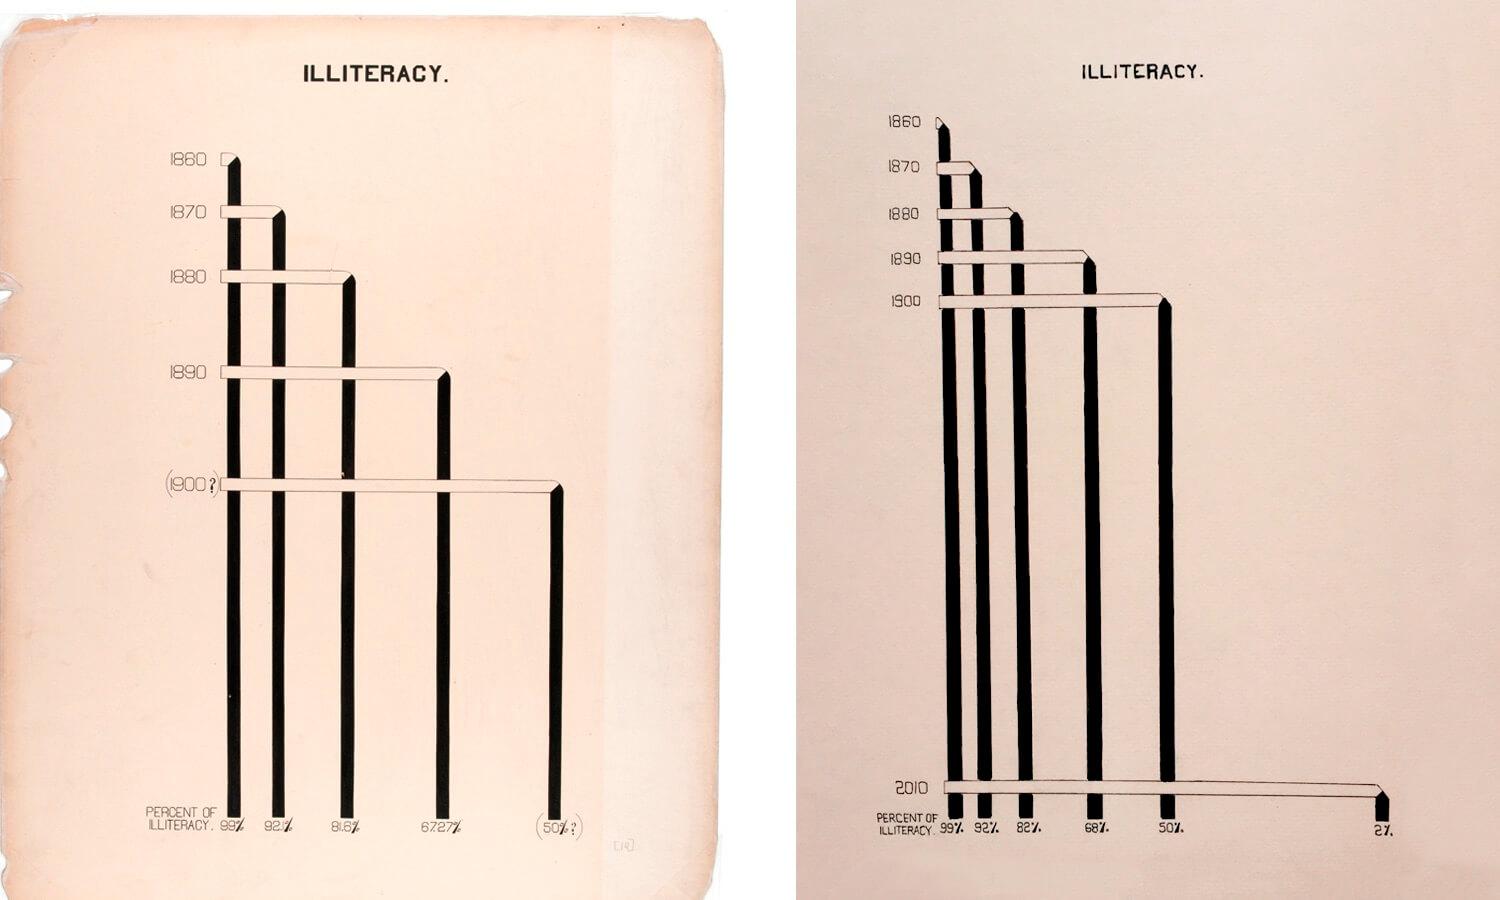
Alongside reproductions of Du Bois’s graphics, the exhibition presented original artwork by Mona Chalabi, Data Editor at The Guardian, repurposing his distinctively clean lines, arresting shapes and bold primary colours for the 21st century. Chalabi’s work demonstrates the enduring relevance of Du Bois’s data visualisation methods and the racial inequalities he fought against.
Co-curated by Professor Paul Goodwin
Selected reviews and articles
"Utterly compelling."
New Scientist
"Quite unbearably moving."
Spectator(opens in new window)
"Eye opening."
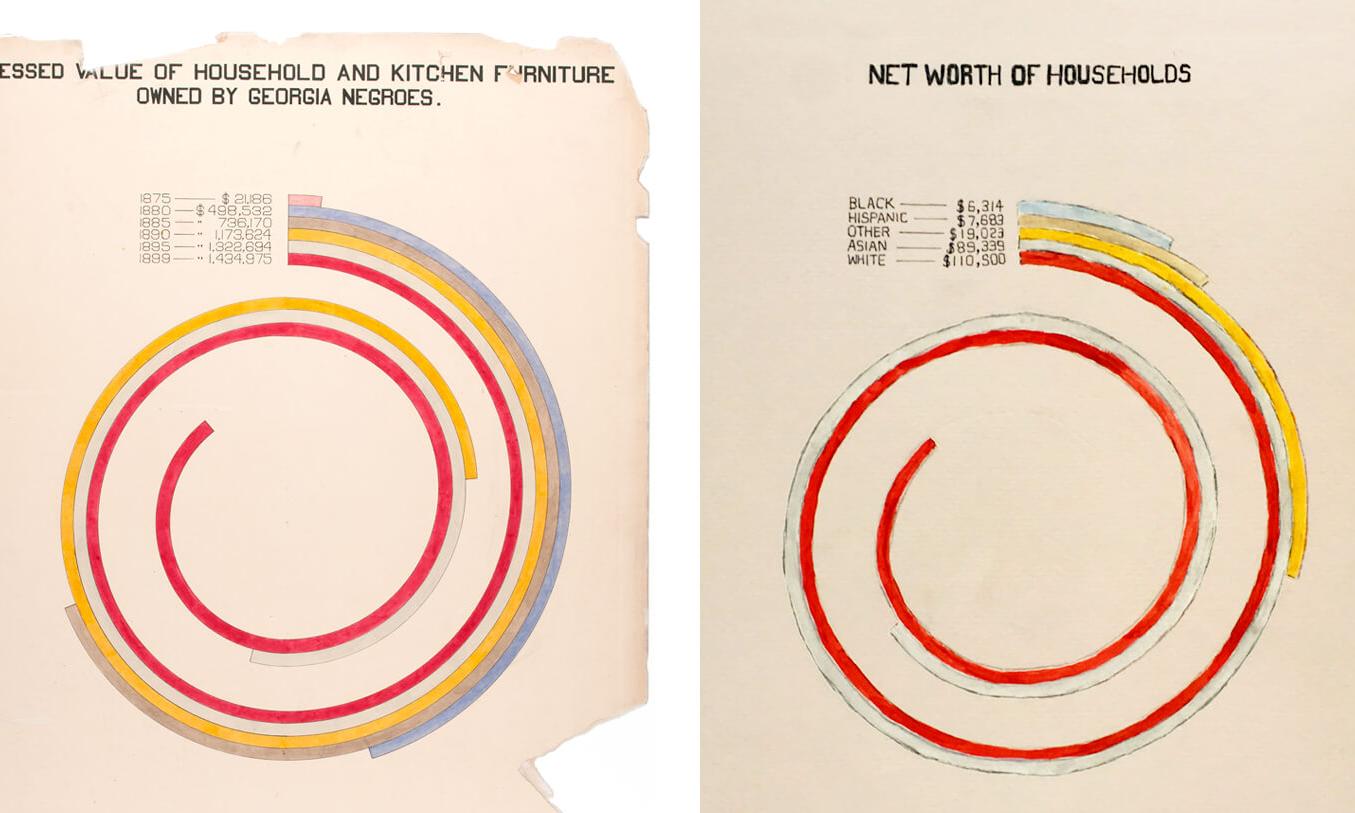
Graphs comparing finances of Black and White households.
All artwork © W. E. B. Du Bois and Mona Chalabi
All photographs © Paul Grover